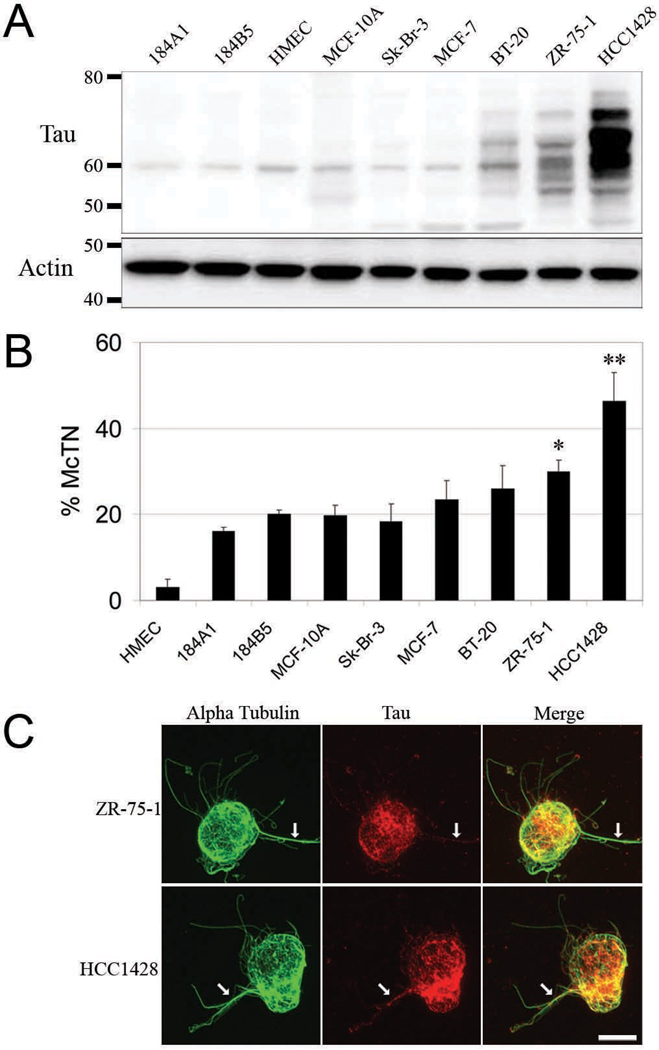
Figure 1. McTN formation increases with tau expression.
(A) Western blots for tau (45–75kDa) revealed an increasing expression and molecular weight range as tumorigenicity increases from the HMEC cells to HCC1428. β-actin served as loading control. (B) McTN frequency increases concomitantly with tau expression. HCC1428 forms significantly more McTNs than lower tau expressing cells lines. ZR-75-1 forms significantly more McTNs than, HMEC, 184A1, 184B5, MCF-10A and Sk-Br-3. Data (n=3) are represented as the mean ± s.d. *P<0.05. (C) ZR-75-1 and HCC1428 were subjected to indirect IF for tau followed by direct IF for α-tubulin. As tau expression increases, localization of tau within McTNs increases (white arrows). Cells and McTNs displayed are representative of those under conditions of actin depolymerization.

