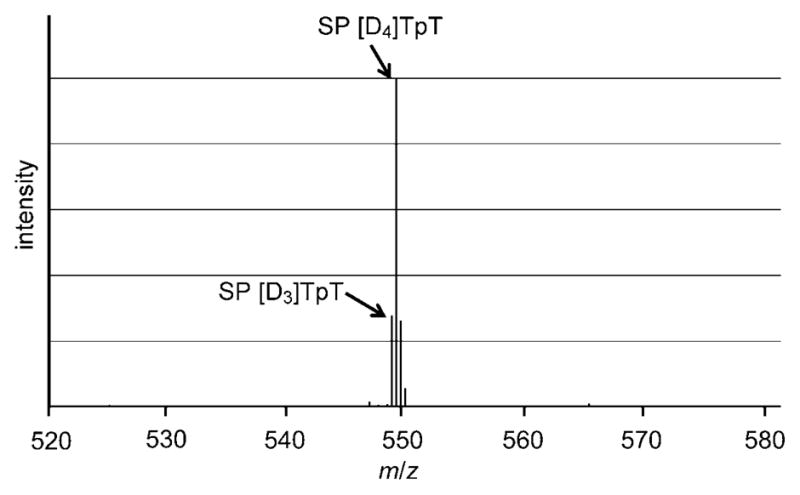
Figure 2.

ESIMS spectrum of the isolated SP [D3]TpT and SP [D4]TpT complexes in the negative ionization mode. The ESIMS spectrum recorded in the positive mode can be found in the Supporting Information. The [M−H]− signal at m/z 548.1 corresponds to the SP [D3]TpT species. The [M−H]− signal at m/z 549.2 corresponds to a combination of SP [D4]TpT and the first isotopic peak of SP [D3]TpT, which is predicted to be 22.4% of the signal intensity of the SP [D3]TpT species. Subtraction of the isotopic contribution of SP [D3]TpT from the signal strength of the peak at m/z 549.2 resulted in the contribution of SP [D4]TpT to the signal intensity. Comparison of this number with the intensity of the peak at m/z 548.1 yielded the primary isotope effect of 3.5.
