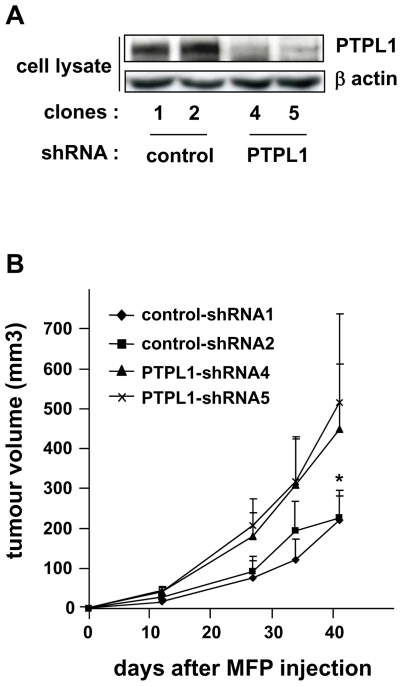
Figure 2. Implication of PTPL1 in breast cancer cells aggressiveness.
A, Expression of PTPL1 in stable cell clones was monitored by western blot using anti-PTPL1 antibodies. The loading control was obtained by re-probing the membrane with anti-actin. B, Six-week-old mice were injected with clonal cell lines in the mammary glands. Tumor volume was measured at the indicated time, and the mean ± 95% confidence interval is shown (n=11 per group). *P<0.0012 for mean of PTPL1-shRNAs versus mean of control-shRNAs (Student’s t-test).

