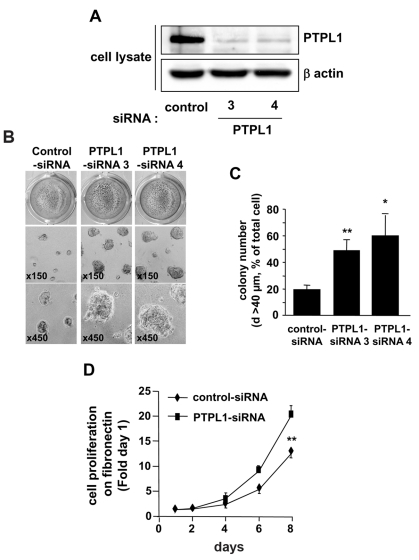
Figure 3. Cell growth on extra-cellular matrices of siRNA-PTPL1 transfected cells.
A, Five days after siRNA transfection, MCF-7 cells were lysed and cell extracts were analyzed by immunoblotting with anti-PTPL1 and anti-actin antibodies. B–C, Mock-transfected (control-siRNA) and PTPL1-siRNA (PTPL1-siRNA) cell lines were coated on Matrigel. B, Phase contrast optical photomicrographs after five days of culture and photographs after p-iodonitrotetrazolium violet staining. C, Colonies on Matrigel with a diameter greater than 40 μm were counted on four different fields per well. The data given are the mean ± s.d. of quadruplet samples. *P=0.003 and **P<0.001 versus control-siRNA. One representative experiment out of four is shown. D, One day after siRNA transfection, cells were plated on fibronectin coated wells and the DNA was quantified at different days, as described in the Materials and Methods. Cell growth was expressed relative to day one (mean ± s.d. of six wells from two independent experiments out of four). **P=0.0001 versus control-siRNA.

