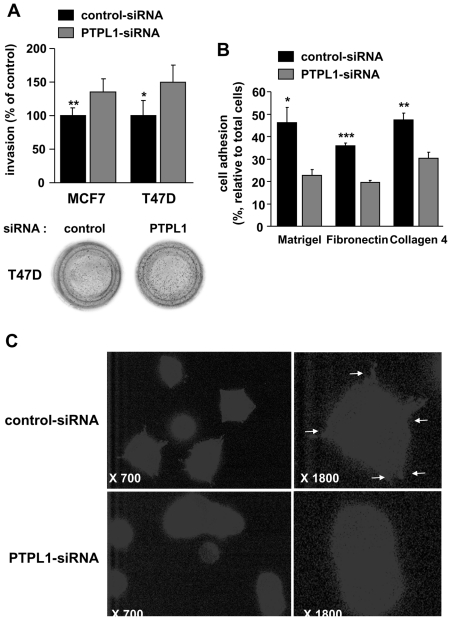
Figure 4. Effect of PTPL1 downregulation on cell invasion and adhesion.
A, Two days after transfection, cells were plated onto the upper well of a Matrigel coated Transwell Boyden Chamber and allowed to migrate toward the chemoattractant 10% FBS for 48 h. The percentage of cells that migrated through Matrigel-coated filters was quantified relative to the total number of seeded cells. The data represent the percentage of cells that migrated to the lower side of the filter relative to control-siRNA cells. The results are the means ± s.d of triplicate samples from two independent experiments (MCF-7; n=6) or quadruplet samples from one experiment (T47D). *P=0.036, **P=0.003. Photographs are representative brilliant blue stained filters. B, Five days after siRNA transfection, MCF-7 cells were plated in triplicate on Matrigel, collagen 4 or fibronectin for 30min. Data represent the percentage of adherent cells compared to the total seeded cells. The results are means ± s.d of triplicate. *P=0.011, **P=0.004, ***P=0.0001. One representative experiment out of four is shown. C, Immunofluorescence of cells plated on fibronectin was performed using a phosphotyrosine antibody. Representative cells from one experiment out of two. For control and PTPL1 siRNA transfected cells, left panels correspond to a 700-fold magnification and right panels correspond to an 1800-fold magnification.

