Fig. 4.

A fluorescent reporter protein to monitor PI-PLC activation in single live P. berghei gametocytes.
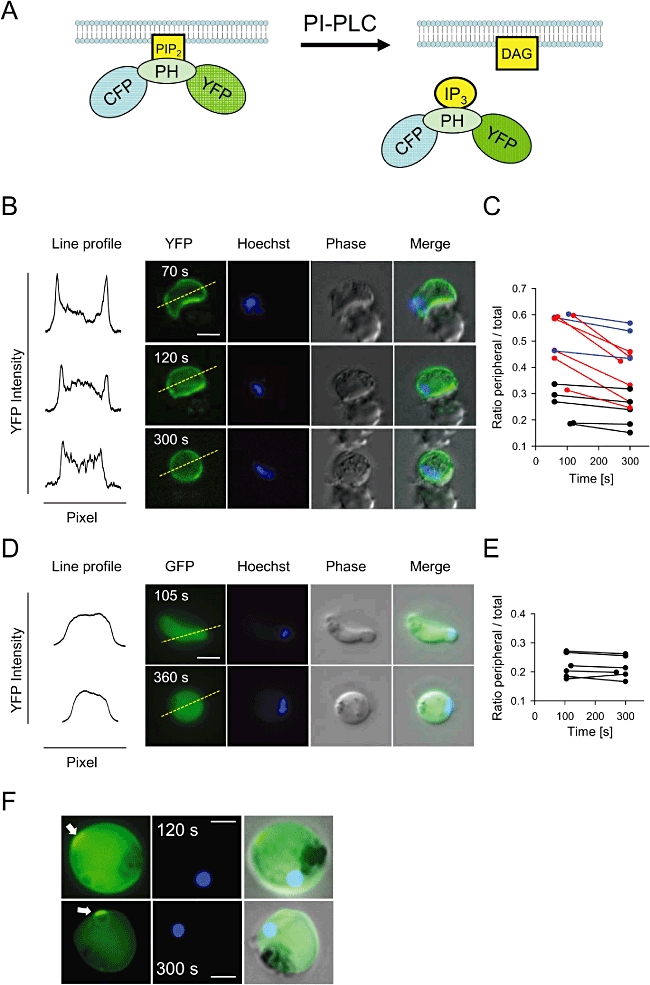
A. Scheme illustrating translocation from the plasma membrane to the cytosol of the CFP–PH–YFP protein upon PI-PLC activation.
B. Light microscopic images of a CFP–PH–YFP expressing macrogametocyte recorded at different time points after activation with XA. The first column shows the line profiles of the intensity of YFP fluorescence along the dashed lines in the corresponding YFP images.
C. CFP–PH–YFP redistribution in 14 randomly selected macrogametocytes. See text for an explanation of line colours.
D. Time lapse microscopy and intensity profiles after activation of macrogametocytes expressing GFP without a PH domain as a control probe.
E. Absence of peripheral localization and redistribution of GFP lacking a PH domain.
F. Fluorescence images of typical CFP–PH–YFP expressing macrogametocytes showing a disc-like structure (arrows) seen in the majority of gametocytes after rounding up. All indicated times are seconds post activation. The scale bar is 2 µm in all panels.
