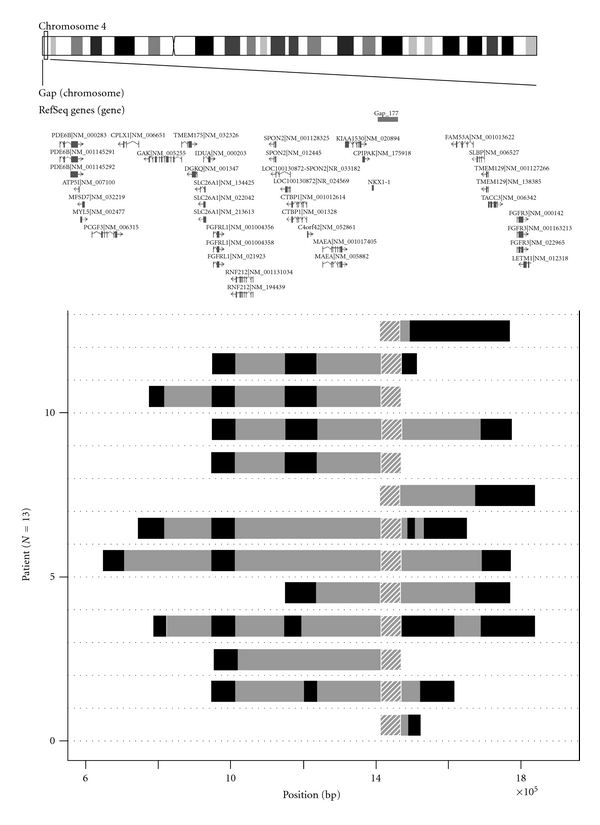
Figure 1.

Genomic region harboring copy number loss of 1.3-Mb 4p16.3 subtelomeric region in 13 early-onset T2DM patients. Data measured by deCODE/Illumina CNV370K chip were analyzed by the PennCNV program. Genome structure of the 13 patients are aligned as horizontal bars from genome position 550,000 (left) to position 1,850,000 (right). Hatched region at position 1,423,147–1,478,646 represents genome gap-177 region. Dark solid horizontal bars represent extent of copy number loss in each T2DM patient. Gray regions between the dark bars represent intervals where copy number loss could not be inferred due to poor probe coverage. Upper map shows ideogram of chromosome 4 and the positions of putative genes in 4p16.3 region described in Database of Genomic Variants (http://projects.tcag.ca/variation/). Position is given relative to NCBI Build 35 for the chromosome 4.
