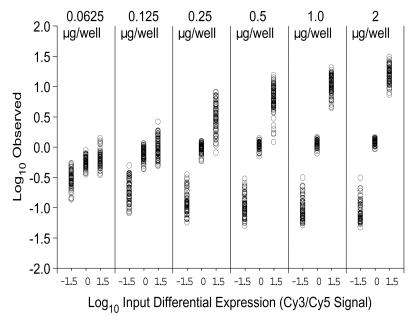
Figure 1.
Impact of input DNA concentration on differential gene expression. A dilution series of PCR product for three yeast control fragments was arrayed in triplicate in each of four quadrants. The amount of PCR product in the well prior to arraying is indicated above each panel. Input RNA ratios for labeling with Cy3 versus Cy5 for the three fragments were 30:1, 1:1 and 1:30. The log10 of observed differential expression is plotted as a function of log10 of input RNA ratios.

