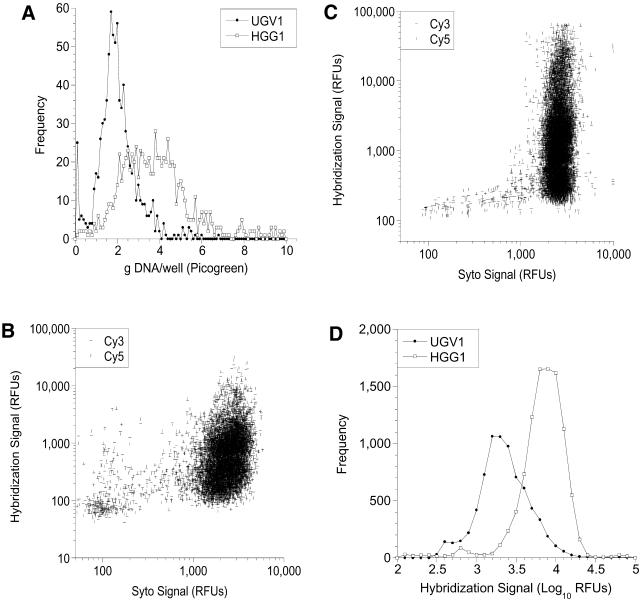
Figure 2.
Quality control analysis of microarray batches. A set of eight wells randomly selected from each of 104 96-well plates from microarray types UGV1 and HGG1 was analyzed with PicoGreen. The distribution of DNA concentrations is shown in (A). The amount of hybridization signal with a complex probe (Cy3 Brain/Cy5 Heart) is shown as a function of the amount of DNA retained on the glass for microarray types UGV1 (B) and HGG1 (C). Signal distributions from hybridizations with a vector-specific oligonucleotide probe for each array type are shown in (D).

