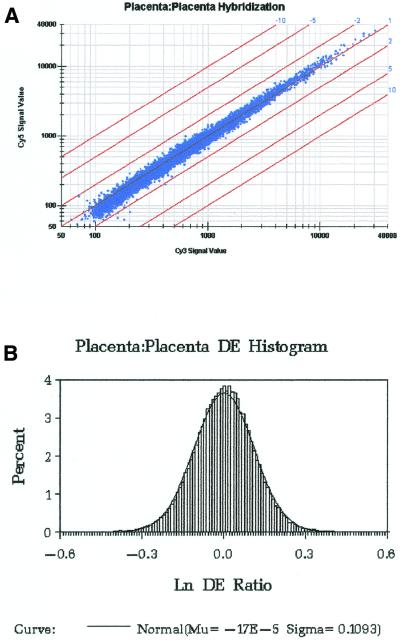
Figure 4.
(A) Scatter plot of the calibrated Cy3 versus Cy5 fluorescence response from a typical placenta:placenta hybridization. The diagonal line through the origin corresponds to the expected DE of 1. The other diagonal lines define DE values as indicated next to the line. (B) Histogram showing the distribution of elements by logn of their experimentally derived DEs for 10 homotypic placental hybridizations.

