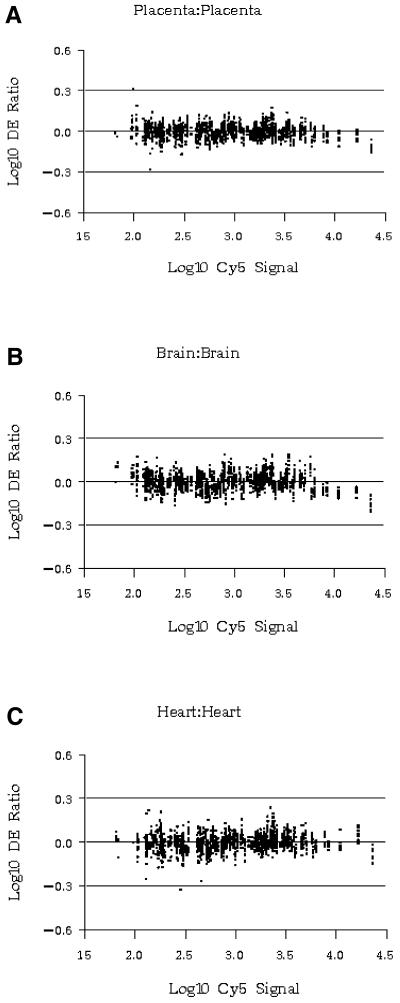
Figure 5.
Variation in individual element responses for 180 randomly selected genes over the full range of observed signal response (expressed as log Cy5 signal). All 10 replicate data points for each selected element are plotted along the vertical axis. Horizontal lines define the tolerance interval outside of which DE was deemed significant (see text). (A) Homotypic placental hybridizations. (B) Homotypic brain hybridizations. (C) Homotypic heart hybridizations.

