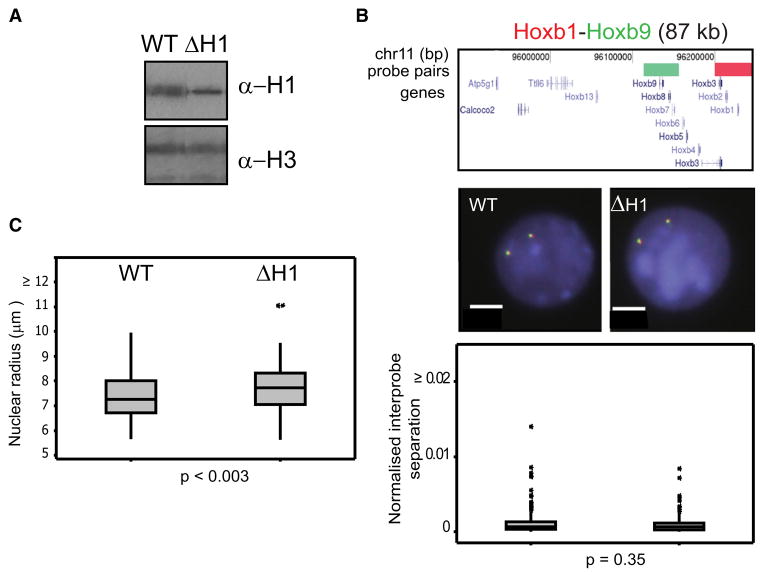
Figure 4. Chromatin Compaction in H1-Depleted Cells.
(A) Western blot showing reduced levels of H1 in ΔH1 compared to WT ESCs.
(B) 2D FISH with probes for Hoxb1 (red) and Hoxd9 (green) in nuclei of WT and ΔH1 cells counterstained with DAPI (blue). Scale bar = 5 μm. Probe position and the distribution of normalized interprobe distances between WT and ΔH1 cells are as in Figure 2A. n = 2 biological replicates, each of 100 loci.
(C) Box plot showing the distribution of nuclear sizes (plotted as radius in μm of a circle of equal area to that of the nucleus) for WT and ΔH1 cells. n = 100 cells.

