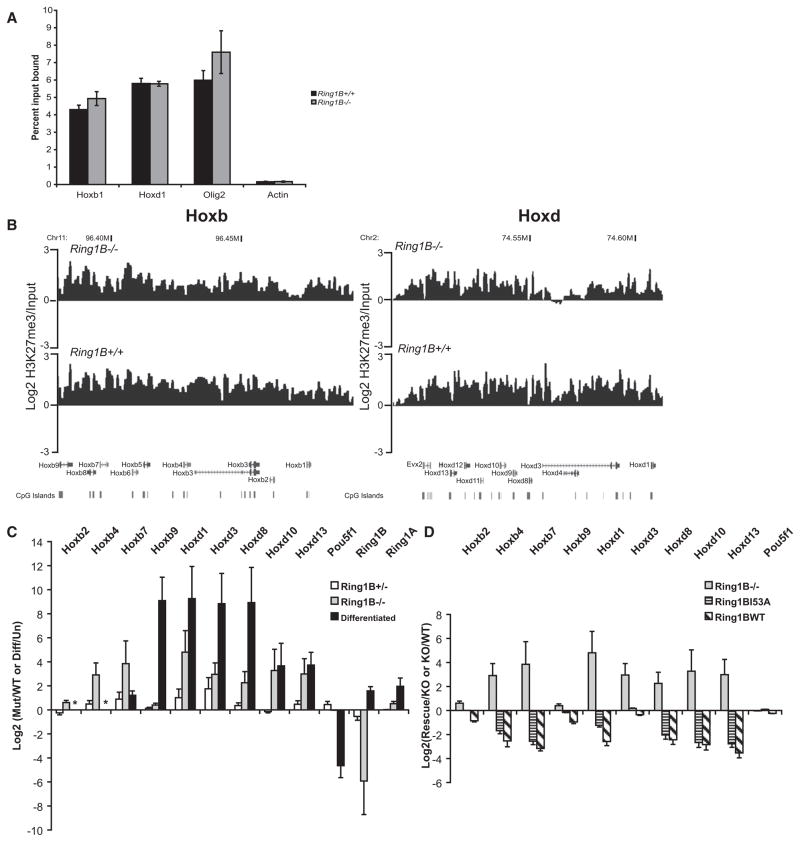
Figure 5. H3K27me3 and Gene Expression at Hox Loci in Ring1B Mutant Cells.
(A) ChIP for H3K27me3 at the promoters of Hoxb1, Hoxd1, Olig2, and β-actin, assayed by qRT-PCR, in WT (+/+) (black) or Ring1B−/− cells (gray). Enrichment is shown as mean percent input bound ± SEM over three biological replicates.
(B) Mean log2 H3K27me3/input over Hoxb (left) and Hoxd (right), established by microarray hybridization of ChIPed material from Ring1B3−/− (top) or WT (+/+) (bottom) ESCs. Running mean of three biological and technical replicates (n = 5), with 1 kb window size and a 1 kb increment, is shown. Map position and RefSeq gene annotations are as in Figure 1B.
(C) Log2 ratios ± SEM for Hox expression, assayed by qRT-PCR, in Ring1B mutant cells (+/−, white bars; −/−, gray bars) relative to WT. This is compared to the log2 changes in gene expression during the differentiation (diff/un) of OS25 ESCs (black bars). Asterisks indicate where levels of Hoxb2 and Hoxb4 induction during differentiation could not be analyzed by qRT-PCR because the transcripts in undifferentiated cells were only detectable after 40 cycles of PCR.
(D) Log2 ratios ± SEM for Hox gene expression, from three biological replicates assayed by qRT-PCR, in Ring1B3−/− cells relative to WT (KO/WT, gray bars) (the same as in C) or in cells rescued with WT or I53A mutant relative to the Ring1B−/− cells (Rescue/KO, hatched and striped bars).

