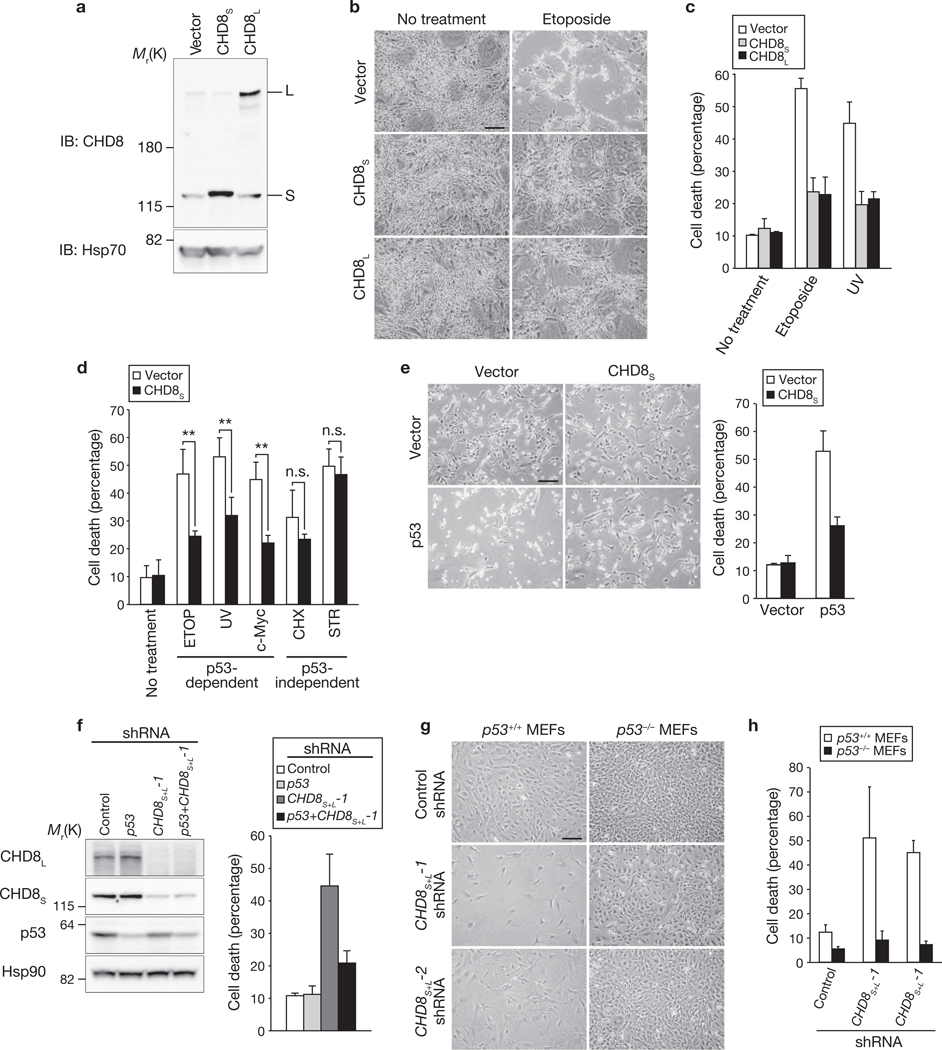
Figure 1.
Anti-apoptotic activity of CHD8. (a–c) NIH 3T3 cells overexpressing CHD8S or CHD8L were subjected to immunoblot (IB, a) analysis with anti-CHD8 and exposed to genotoxic stress. Cells were examined by phase-contrast microscopy (b) and the percentage of dead cells was determined by trypan blue staining (c). Data in c are mean ± s.d., n = 3. (d) NIH 3T3 cells overexpressing CHD8S were exposed to etoposide (ETOP, 50 µM), cycloheximide (CHX, 100 µg ml−1), staurosporine (STR, 1 µM), UV radiation or c-Myc overexpression. Data in d are mean ± s.d., n = 3 (**P < 0.01; n.s., not significant; P > 0.05; Student’s t-test). (e) U2OS cells were infected with retroviral vectors for CHD8S or p53 and were stained with trypan blue (left panel). Data shown in the right panel are mean ± s.d., n = 3. (f) U2OS cells were infected with retroviral vectors encoding shRNAs specific for p53, both CHD8S and CHD8L (CHD8S+L-1) or EGFP (control), subjected to immunoblotting (left panel), stained with trypan blue and the percentage of dead cells determined (right panel). Data shown in the right panel are mean ± s.d., n = 3. (g, h) p53+/+ or p53−/− MEFs infected with retroviral vectors for CHD8S+L-1 or CHD8S+L-2 shRNAs were examined by phasecontrast microscopy (g) and the percentage of dead cells determined by trypan blue staining (h). Data in h are mean ± s.d., n = 3. Scale bars are 100 µm (b, e, g).

