
Figure 7.
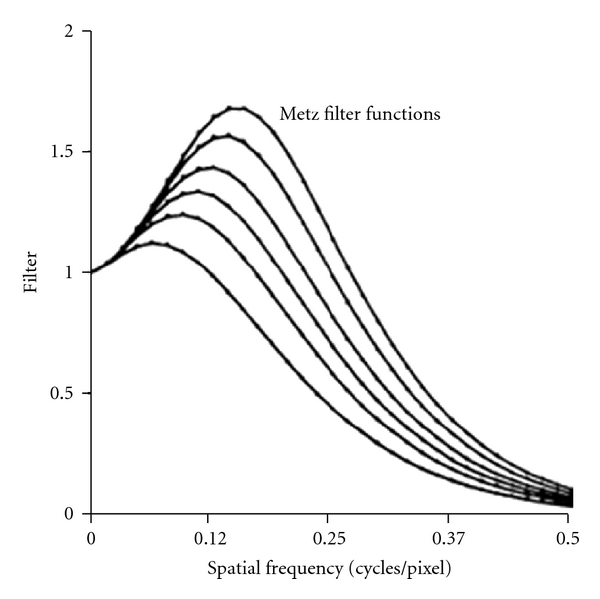
Plot of Metz filter for total counts of 20.000, 50.000, 100.000, 200.000, 500.000, and 1 million counts from lowest to highest curve [10].
Official websites use .gov
A
.gov website belongs to an official
government organization in the United States.
Secure .gov websites use HTTPS
A lock (
) or https:// means you've safely
connected to the .gov website. Share sensitive
information only on official, secure websites.
Plot of Metz filter for total counts of 20.000, 50.000, 100.000, 200.000, 500.000, and 1 million counts from lowest to highest curve [10].