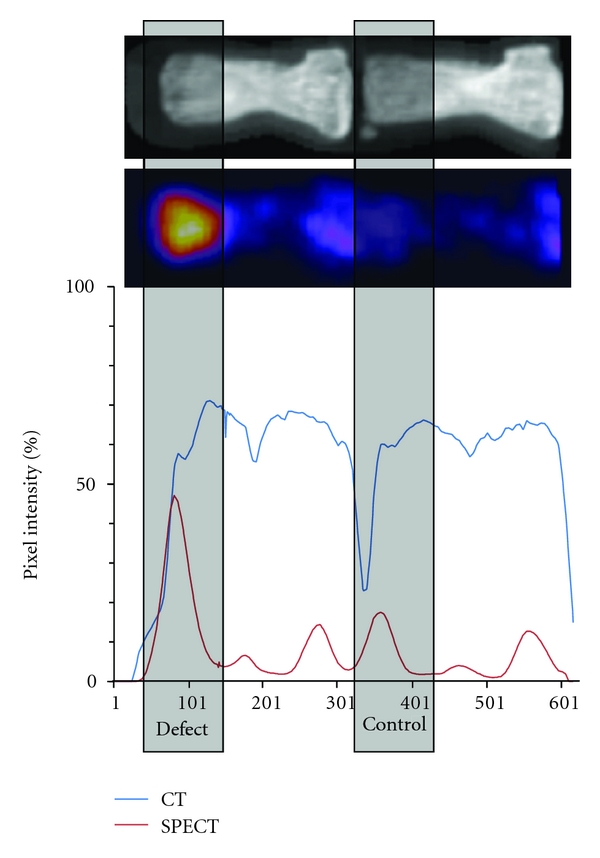
Figure 4.

Comparison of intensities from CT (blue line) and nano-SPECT (red line) images. A representative image shows that the peak intensity of a vertebral epiphysis can be localized on the basis of the CT image and compared to the defect site. SPECT intensities reflect osteoblast activity. The defect site has a significantly higher osteoblast activity than the normal bone.
