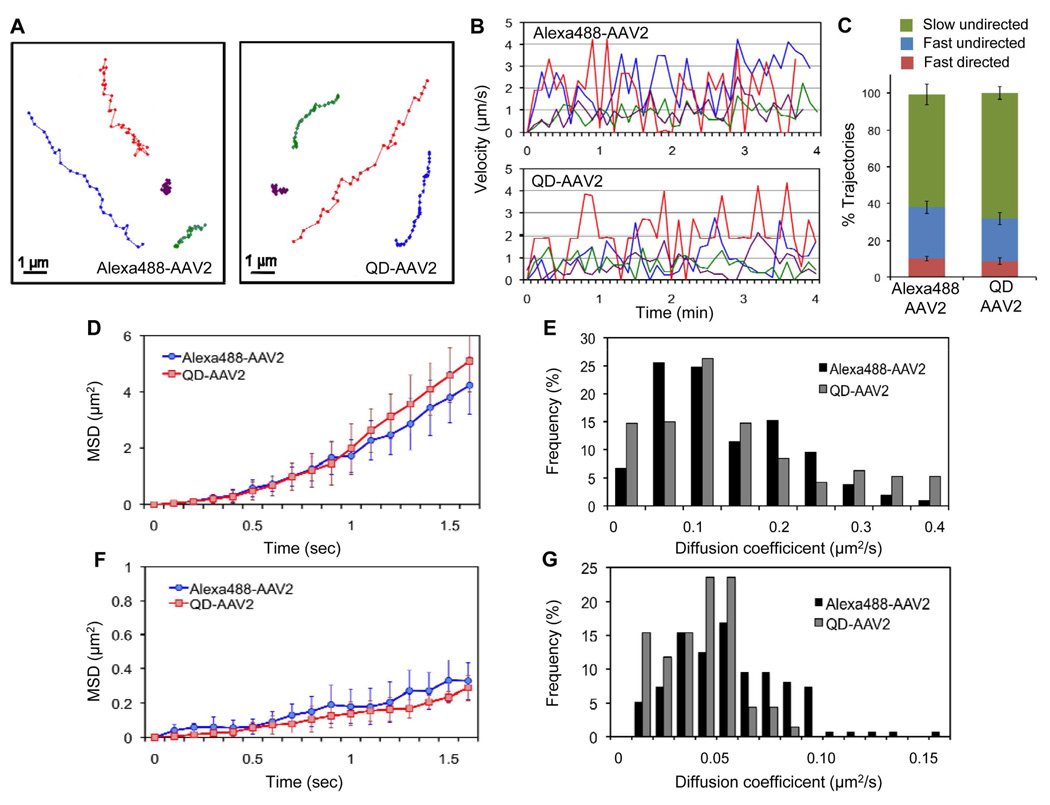
Figure 2.
Quantitative analysis of the intracellular viral motility of QD-labeled and Alexa488-labeled AAV2. (A, B) Representative trajectories of Alexa488- and QD-labeled AAV2 trafficking in HeLa cells. HeLa cells were incubated with Alexa488-labeled or QD-labeled AAV2 for 10 min at 37°C, after which confocal time-lapse images were then recorded. Typical trajectories for Alexa488-AAV2 and QD-labeled AAV2 are presented (A), and the time trajectories of the viral velocity are shown (B). (C) The fraction of trajectories of Alexa488-AAV2 and QD-AAV2 that are categorized as “slow undirected”, “fast undirected”, and “fast directed” as defined in the text. Error bars represent the standard deviation of the mean from triplicate experiments (total 595 trajectories). (D to G) Mean-square displacement (MSD) and diffusion coefficient analysis of the directed transport subgroup and the undirected transport subgroup. A large number of viral particles within the cytoplasm (~50 trajectories, ~900 frames) were tracked and further analyzed. MSD versus time for the directed transport (D) and for the undirected transport subgroup (F) were plotted. The diffusion coefficients of the directed transport (E) and the undirected transport (G) subgroups were calculated from the slope of the MSD plot.

