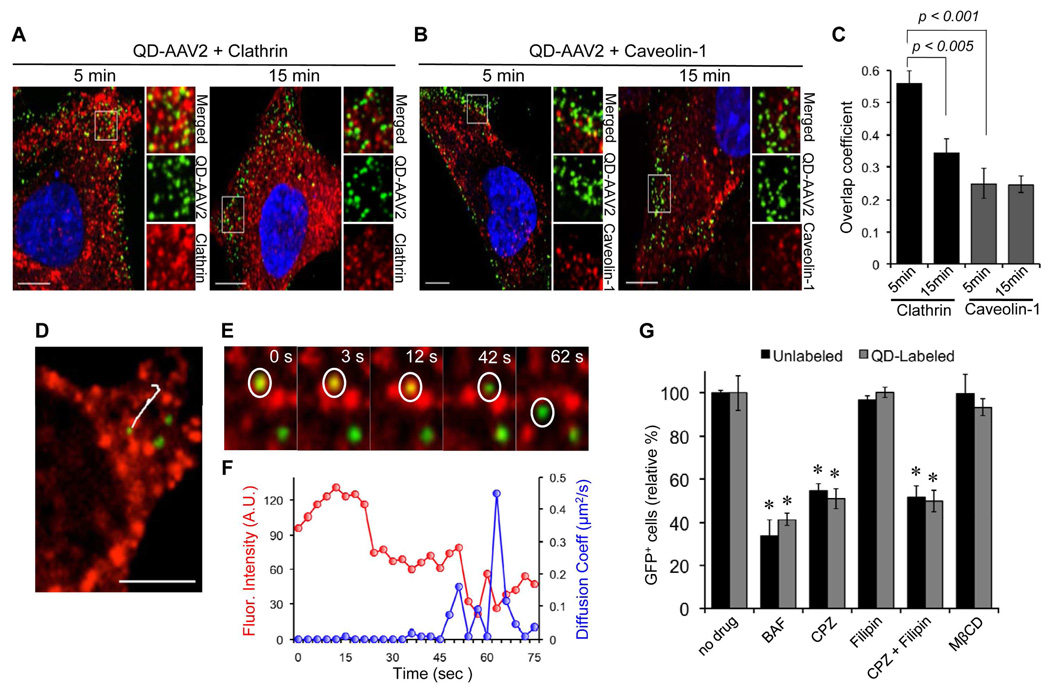
Figure 3.
Clathrin/Caveolin-dependent entry of AAV2. (A, B) HeLa cells were incubated with QD-labeled AAV2 for 30 min at 4°C to synchronize infection. The cells were then shifted to 37°C for 5 or 15 min, fixed, permeabilized, and immunostained with anti-clathrin (A) or anti-caveolin-1 antibody (B). The boxed regions are enlarged in the right panels. Scale bar represents 5 µm. (C) Quantification of QD-AAV2 colocalized with clathrin or caveolin-1 signals after 5 or 15 min of incubation. Colocalization coefficients were calculated using the Manders' overlap coefficient by viewing more than 10 cells at each time point using the Nikon NIS-Elements software. Error bars represent the standard deviation of the mean from analysis of multiple images. (D to F) Real-time monitoring of QD-AAV2 internalization through the clathrin-coated pit. HeLa cells seeded on a glass bottom dish were transiently transfected with mRFP-clathrin (red). At 24 h post-transfection, the cells were incubated with QD-labeled AAV2 (green) for 30 min at 4°C, and were then warmed to 37°C to initiate virus internalization. Confocal time-lapse images were then recorded. A representative trajectory of QD-AAV2 in HeLa cells expressing mRFP-clathrin (D) and the selected frames of the real-time imaging (E) are presented. (F) Kinetics of the fluorescence intensity of mRFP-clathrin (red) and diffusion coefficients (blue) of AAV2 particle indicated by the white circle is shown. Scale bar represents 2 µm. (G) Inhibition of low pH-dependent endosomal processing by bafilomycin A1 (BAF, 50 nM), clathrin-dependent internalization by chlorpromazine (CPZ, 25 µg/ml), caveolin-dependent internalization by filipin (5 µg/ml), or depletion of cholesterol by methyl-beta-cyclodextrin (MβCD, 15 mM). HeLa cells were preincubated with the indicated drugs at 37°C for 30 min except for MβCD (15 min). The cells (1 × 10⁵) were spin-infected with unlabeled or QD-labeled AAV2 in the presence of drugs (BAF, CPZ, and filipin) or in the absence of drug (MβCD). After an additional 3 h of incubation with drugs (BAF, CPZ, and filipin) at 37°C, the cells were washed with PBS and replenished with fresh media. The percentage of GFP-positive cells was analyzed by flow cytometry. Error bars represent the standard deviation of the mean from triplicate experiments. Asterisk indicates comparison to the no drug treatment group (* p<0.05).

