
Fig. 1.
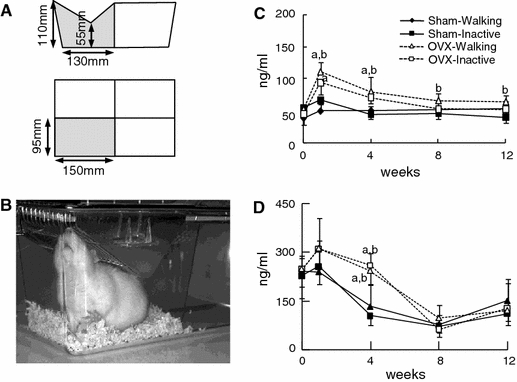
Experimental conditions and metabolic bone markers. a Dimensions of the cages used for restraining rats. b Photograph of a rat in a restraining cage. c Serum levels of CTx. d Serum levels of osteocalcin. In c and d, solid squares and triangles show mean values for the Sham-Walking and Sham-Inactive rat groups, respectively, and open squares and triangles show median values for the OVX-Walking and OVX-Inactive rat groups, respectively. Vertical bars show the SEM. Differences with P values of <0.05 are statistically significant. The letter “a” represents a significant difference between the OVX groups and the Sham-Walking group, and the letter “b” represents a significant difference between the OVX groups and the Sham-Inactive group