
Fig. 2.
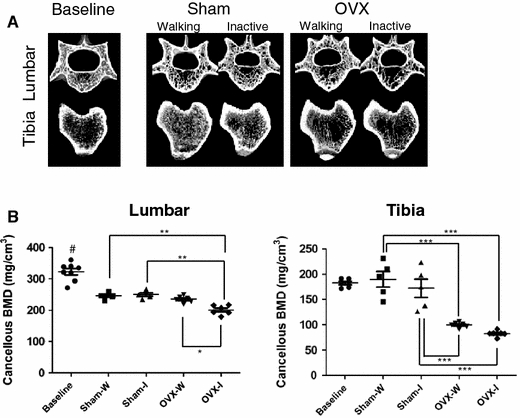
Effect of inactivity on micro-CT and pQCT parameters for both Inactive groups. a Representative 3D images of a lumbar vertebra (L4) and tibia at 14 weeks (Baseline, BL) and after 15 weeks of forced inactivity (at 29 weeks). b Cancellous BMD values from pQCT measurements. Filled circles, squares, triangles, down-pointing triangles and diamonds represent individual values in Baseline, Sham-Walking, Sham-Inactive, OVX-Walking and OVX-Inactive groups, respectively. Data values for each rat are plotted together with three horizontal lines the show the values of the median and ± SEM. Asterisks above connected pairs of values indicate significant differences (***, **, and * correspond to P < 0.001, P < 0.01 and P < 0.05, respectively). A pound symbol indicates a significance difference (P < 0.05) between the Baseline and Sham-Walking groups