
Fig. 4.
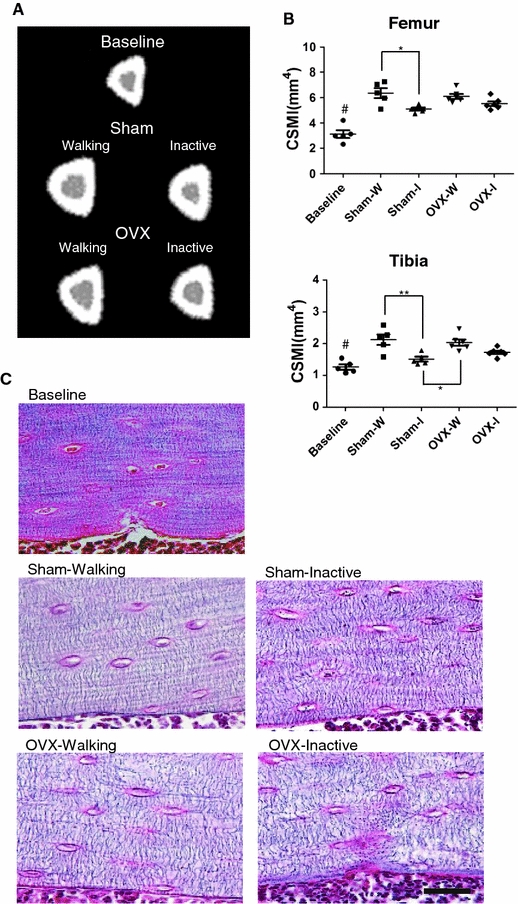
Characterization of tibial and femoral cortical bone. a Cross-sectional pQCT tomograms of tibia show differences brought by 15-weeks of inactivity, OVX, or both. b Cross-sectional moment of inertia (CSMI, axis on the frontal plane) calculated from the pQCT measurements as described in “Materials and methods”. Some other parameters are provided in Table 2. As in Fig. 2b, individual values are shown, asterisks over connected pairs indicate significant differences, and a pound symbol indicates a significance difference (P < 0.05) between the Baseline and Sham-Walking groups. c Characteristics of osteocyte canaliculi visualized by Bodian’s staining in the endocortical surface area at mid-shaft of the left tibia. Four experimental groups and the baseline group are compared. Bars represent 50 μm