
Fig. 7.
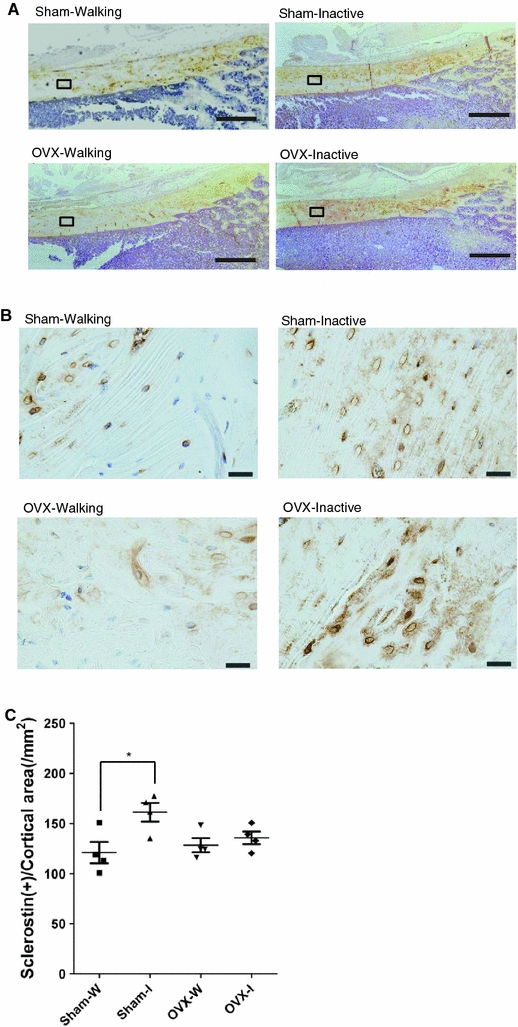
Immunohistochemical staining of sclerostin (a, b) and the numbers of positively-stained osteocytes (c) in the Walking and Inactive rat groups. Cortical sections were prepared from decalcified bone from the distal half of the left femur that had been embedded in paraffin. Localization of sclerostin visible in the intracortical area bounded by rectangles in a was magnified as in b. Original magnifications are ×10 (a) and ×40 (b). Bars represent 500 μm in a and 50 μm in b. Note the heavy staining of lacuno-canalicular network in both the Sham-Inactive and OVX-Inactive rat groups in b; stained cell bodies and lacunae were detected in patches in the Walking rat groups. In c, number of stained cells were compared by counting over two hundred cells in each of the five areas in each sample (n = 4). Individual values are marked as in Fig. 2b. *Significance between the intervention/control groups (P < 0.05). The Baseline rat group was not examined