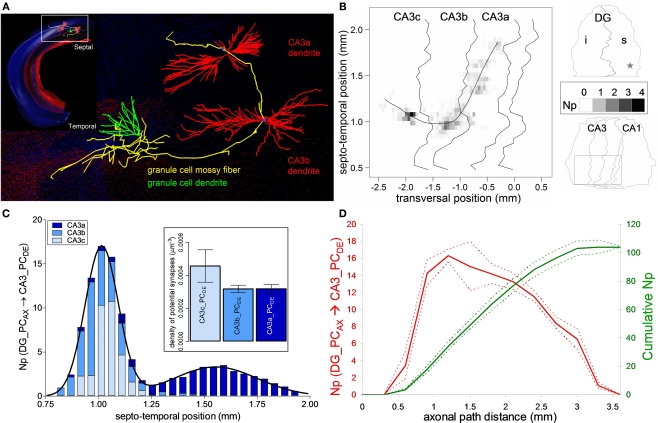
Figure 2.
Potential connectivity analysis for DG mossy fiber onto CA3 pyramidal cells. (A) Relative orientation of a dentate granule cell (axon: yellow, dendrite: green) and of the dendritic trees of two pyramidal cells from CA3b and CA3a. Inset shows the arbor embeddings within the 3D hippocampus reconstruction. (B) Potential synapse map: The average number (Np) of potential contacts (gray scale) is based on simulations of 25 pre-synaptic positions around the central granule cell location, which is marked by a star in the top (DG) right panel. The bottom (CA3/CA1) right panel demarcates the sub-regions invaded by the axon (square box), corresponding to the main panel. The fitting line is a cubic spline function (r2 = 0.85) of septo-temporal vs. transversal positions weight-averaged by the potential synapse numbers. (C) Average number of potential contacts in each of the CA3 sub-regions, fitted with two Gaussian curves. Inset shows the density of potential synapses. (D) Number (left axis, red) and cumulative count (right axis, green) of potential synapses along axonal path distance. The solid and dashed colored lines correspond to averages and 95% confidence interval around the mean.

