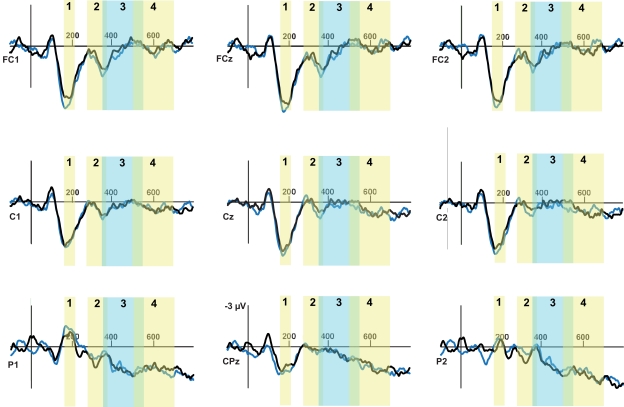
Figure 2.
Event related potential traces for false sentences for nine selected sites across the scalp, time locked to onset of the critical word (presented at 0 ms). Negative activation is plotted up. The blue lines show the False-Mismatched condition, the black line shows the False-Matched condition. The limits of the early (270–370) and late (500–700) time windows for analysis are indicated.

