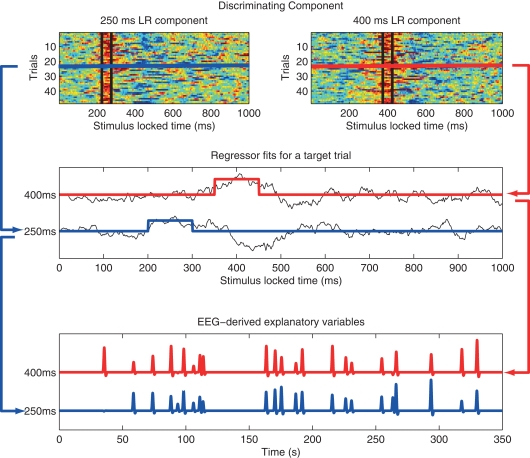
Figure 2.
Method used to construct fMRI regressors from EEG component trial-to-trial variability. Top: y-values for all target trials of the single-trial EEG discriminator for two stimulus-locked windows. Data between black vertical bars indicates those y-values used in the analysis. In this example the window width is 50 ms, with one window centered at 200 ms and the other at 350 ms post stimulus-onset. Hot to cold color scale indicates high likelihood to low likelihood for a target. Middle: y-value for a single target trial for each of the two components (black curves), showing the fMRI event model amplitude as the average of the discriminator output within each 50 ms window, with one modulated event shown for 200 ms (blue) and 350 ms (red). Bottom: Single-trial fMRI regressor for target trials across the entire session for the 200 and 350 ms windows, shown after convolution with the hemodynamic response function. Note that the event timing for each of the two windows is the same, but the event amplitudes are different. A separate fMRI analysis is run for each window, using that window's single-trial output to model single-trial variability. Figure from Goldman et al. (2009).

