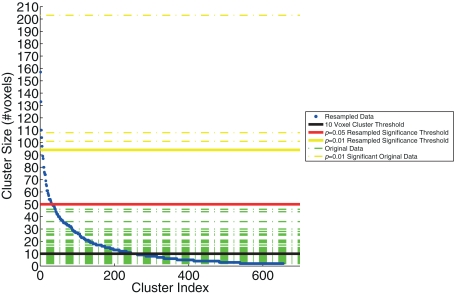
Figure 3.
The resampling method, used to generate the threshold based on cluster size. The resampled data (blue) are sorted and plotted in increasing cluster size (number of voxels). Three significance thresholds are presented: 10 voxel canonical cluster threshold (black solid line), p = 0.05 resampled significance threshold (red solid line), and p = 0.01 resampled significance threshold (yellow solid line). Horizontal dashed lines show the cluster sizes of the original data from Goldman et al. (2009), both those below (green) and the three clusters that exceed (yellow) the resampled cluster size significance threshold (p < 0.01).

