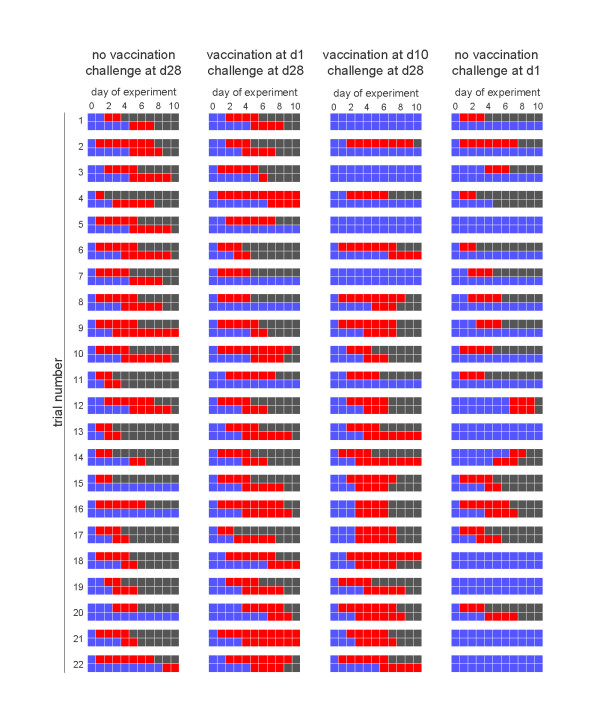
Figure 1.
Overview of the transmission studies. Shown are for each of the four experiments the experimental data of the 22 replicate trials. The top and bottom rows of each trial refer to the experimentally infected chicken and contact chicken, respectively. Blue squares denote chickens that tested negative, red squares represent chickens that tested positive, and black squares denote chickens that died or recovered after infection.

