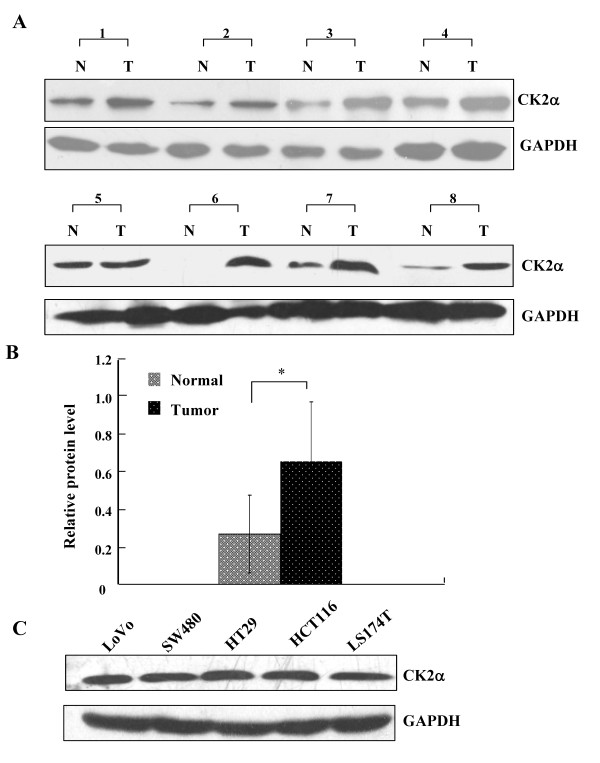
Figure 2.
CK2α protein expression in CRC tissues and cell lines. (A) Western blot analysis of CK2α expression in eight pairs of CRC tissues and adjacent, normal colorectal mucosa tissues. N: normal colorectal mucosa tissue; T: tumor tissue. (B) Quantitative analysis of CK2α protein expression in eight pairs of CRC tissues and adjacent normal colorectal mucosa tissues. Columns, mean CK2α protein level after normalizing the data to GAPDH expression; bars, SD. *P < 0.01. (C) Western blot was used to detect CK2α expression in five CRC cell lines. GAPDH expression was used as a loading control.

