Figure 2.

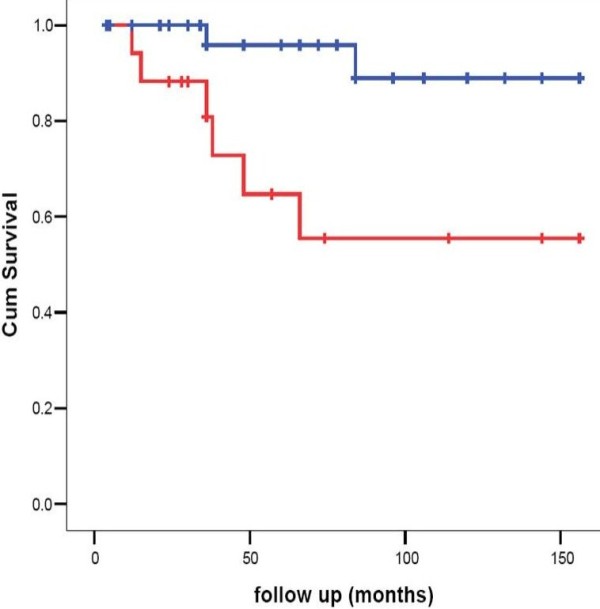
Kaplan Meier curve showing a significant effect of compliance on survival (Blue line: non-compliance < 50% of follow up time. Red line: non-compliance ≥ 50% of follow up time).

Kaplan Meier curve showing a significant effect of compliance on survival (Blue line: non-compliance < 50% of follow up time. Red line: non-compliance ≥ 50% of follow up time).