
Figure 1.
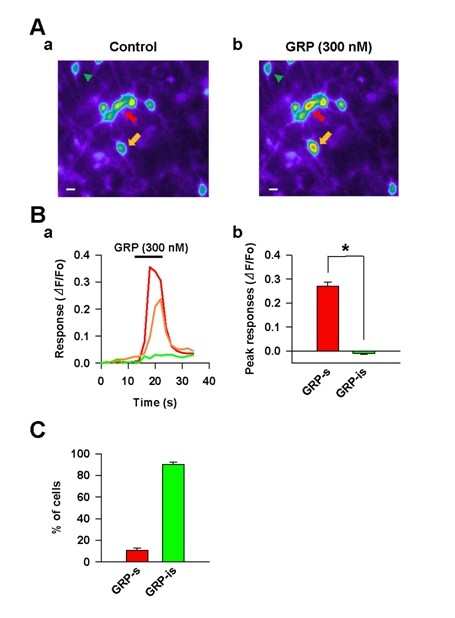
GRP evoked responses in cultured dorsal horn neurons. (A) Two sample images show a subpopulation of dorsal horn neurons responded to GRP. Control (before GRP application) is shown in (a) and the response to 300 nM GRP is shown in (b). Two arrows (red and orange) indicate two GRP-sensitive neurons (GRP-s), and an arrowhead (green) indicates a GRP-insensitive neuron (GRP-is). (B) GRP responses expressed as changes of Fluo-3 intensity (ΔF/F0) in the three cells shown in (a). Pooled results of peak Fluo-3 intensity (ΔF/F0) in GRP-s (red and orange line) and GRP-is (green line) neurons following the application of GRP (10 sec) in (b). Relative fluorescence intensity (ΔF/F0) was used to represent GRP responses and neurons with ΔF/F0 values of ≥ 0.15 (i.e., equal or above 15% baseline fluorescence intensity) were considered as responsive cells [12]. * P < 0.01, significant difference between GRP-s and GRP-is. (C) Percent of cells those are sensitive and insensitive to GRP.