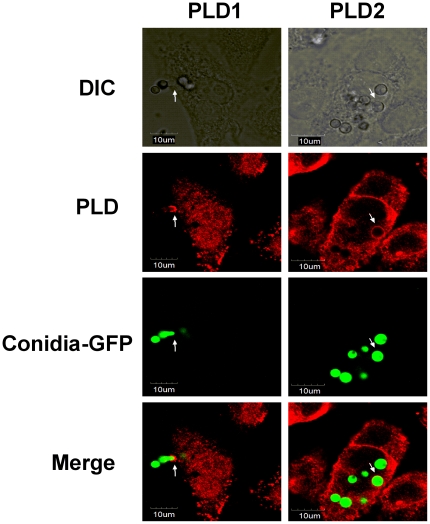
Figure 7. Both PLD1 and PLD2 are associated with A. fumigatus conidia during internalization into A549 cells.
A549 cells were infected with the swollen conidia of A. fumigatus 13073 stably expressing green fluorescence protein (at an MOI of 10) for 30 min. The internalization of A. fumigatus into A549 cells was monitored by differential interference contrast (DIC) microscopy or immunofluorescence using laser confocal microscopy Olympus FluoView FV1000 (green, A. fumigatus conidia; red, PLD1 or PLD2). The images were processed with Olympus FluoView ver. 1.6., and the merged fluorescence images are shown. The data represent 3 similar experiments, and the arrows (white) indicate the association of internalized conidia with PLD. Scale bar, 10 µm.

