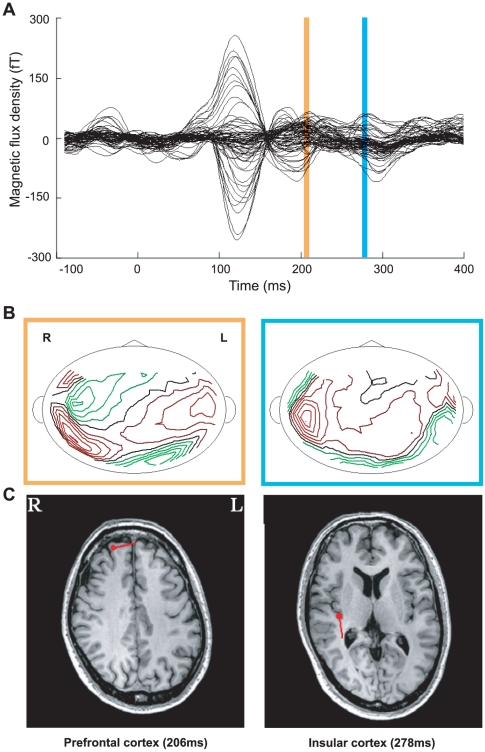
Figure 2. Spatiotemporal pattern of activation in the prefrontal (PFC) and insular cortices (IC).
A. A typical example of gustatory imagery-induced magnetic fields. B. Contour maps at the time points at which the maximum dipole moment appeared in the period colored with yellow and blue strips in A. There is a magnetic sink and source in the IC in each map. C. Dipole localizations superimposed on magnetic resonance images at the time points at which the maximum dipole moment appeared in the period indicated by the yellow and blue strips in A. In the period with the yellow strip, the dipole was located in the PFC. The horizontal direction of the dipole was left. In the period with the blue strip, the dipole was located in the IC. The horizontal direction of the dipole was posterior. R and L in panels B and C indicate right and left, respectively.

