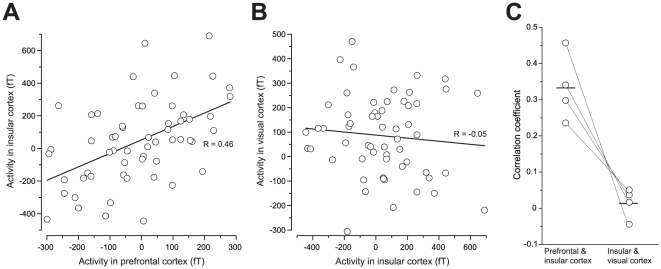
Figure 3. Correlation of the intensity of activation between the IC and other cortices.
A. An example of the correlation between the IC and the PFC in the Letter G-V session. A significant correlation was observed (R = 0.46, P<0.001, Pearson's correlation coefficient test). B. An example of the correlation between the IC and the visual cortex in the Letter G-V session of the same participant as shown in A. No significant correlation was observed (R = −0.05, P>0.1, Pearson's correlation coefficient test). C. Summary of correlation coefficients in four participants who exhibited the activation in the PFC and IC in the right hemisphere in the Letter G-V session.

