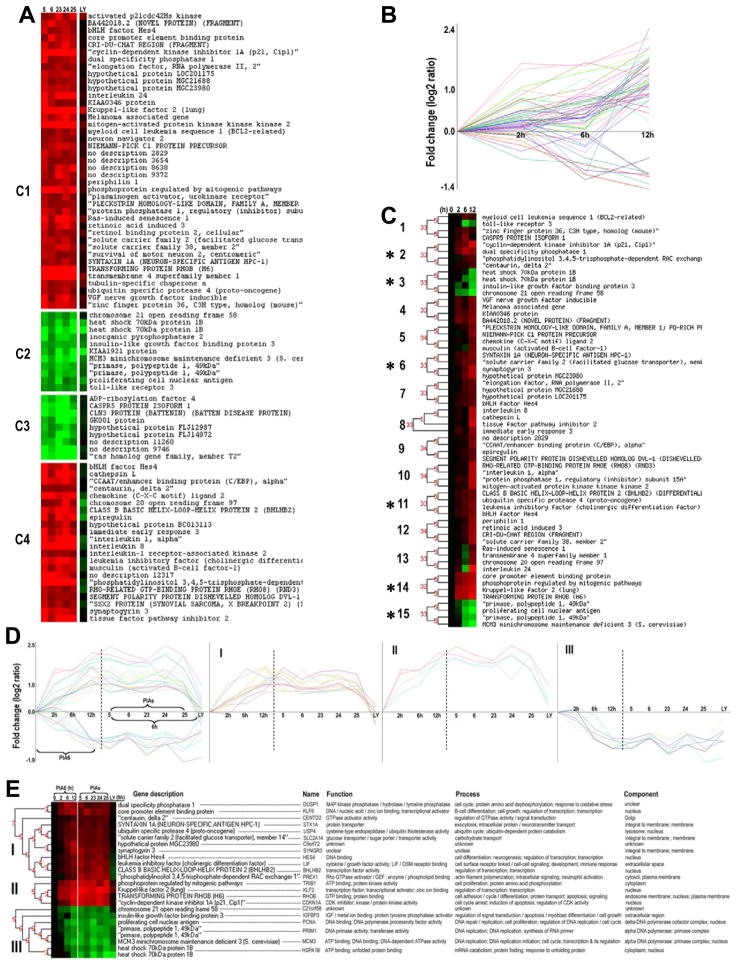
Figure 2.
Identification of genes that changed early and in common with PIA or LY treatment. A) Filtered set of common PIA-regulated genes grouped using k-Means clustering. C1 = genes that were induced by all 5 active PIAs and the PI3K inhibitor LY, C2 = genes suppressed by active PIAs and LY, C3 = genes suppressed by PIAs but not LY, C4 = genes that were induced by PIAs only, not LY. B) Temporal dynamics of common PIA-regulated genes. Expression levels of common PIA-regulated genes from figure 2A were extracted from PIA6 time course experiment and are depicted at the different time points. C) 15 temporal clusters of genes from figure 2B whose expression changed in a similar manner generated by CAGED program. The asterisks mark clusters (2, 3, 6, 11, 14 and 15) that were chosen for further analysis. D) Depiction of genes that were commonly regulated by PIAs and their temporal dynamics. Group I = genes induced early by PIAs but not LY, group II = genes induced early and in common with LY, group III = genes suppressed early by PIAs and in common with LY. E) Identity, function and cellular location of Group I-III genes.

