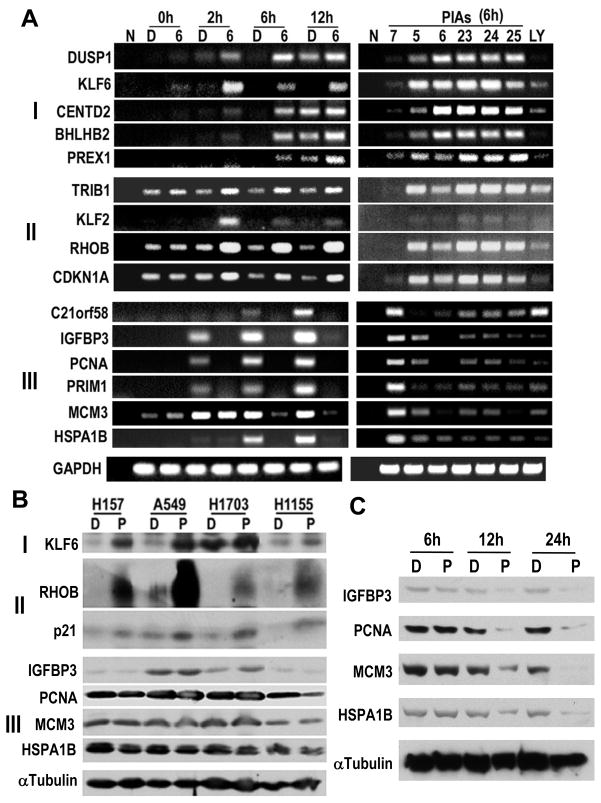
Figure 3.
Validation of microarray data by RT-PCR and immunoblotting. A) Validation of oligonucleotide microarray data by semi-quantitative RT-PCR. Expression of genes from groups I, II and III were evaluated in time course (left panels) and PIA comparison experiments (right panels). N = RNA omitted negative control. B) Immunoblotting analysis of KLF6, RhoB and p21 protein induction in vitro by PIA23 (6h) in 4 NSCLC cell lines. C) Protein expression of PIA-repressed transcripts in H157 cells decreases at later time points. D = DMSO, P = PIA23 (10 μM).

