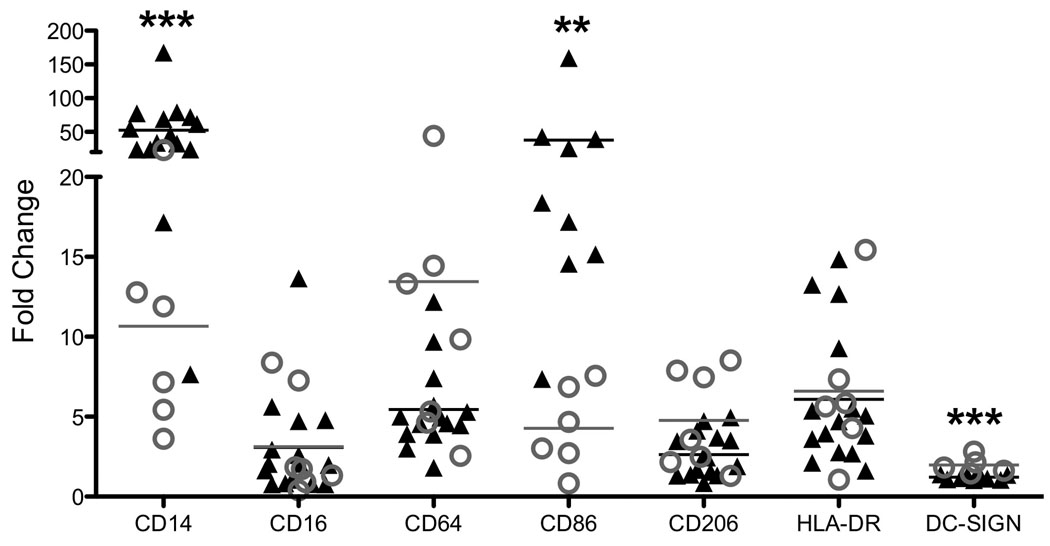
Figure 1.
Flow cytometric analysis of decidual (gray open circle) and peripheral monocyte-derived (black triangle) macrophages. The data from peripheral derived macrophages has been previously published and is included for comparison with decidual cells19. Data are presented as fold increase over the background fluorescent intensity (MFI) of the Isotype control; each data point represents results from an individual animal. Statistical analysis was done to compare decidual to peripheral blood-derived macrophages. ** p-value < 0.01, *** p-value < 0.001

