Figure 4.

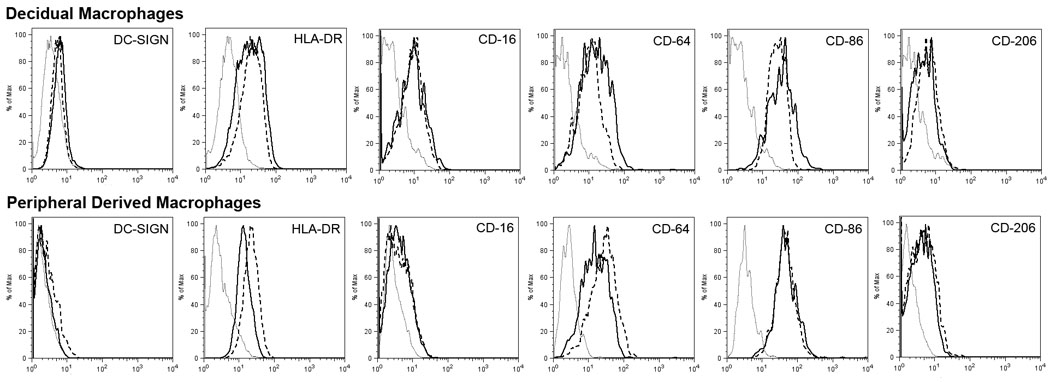
Representative histograms of FACS cytometric analysis: macrophages (solid line), macrophages after co-culture with trophoblasts for 7 days (dashed line), and matched isotype (dotted line).

Representative histograms of FACS cytometric analysis: macrophages (solid line), macrophages after co-culture with trophoblasts for 7 days (dashed line), and matched isotype (dotted line).