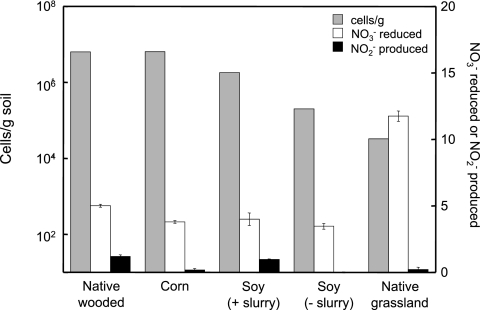
FIG 1 .
Populations of AH2DS-oxidizing, nitrate-reducing cells and degrees of nitrate reduction and nitrite production. Grey bars represent populations of AH2DS-oxidizing, nitrate-reducing cells in agricultural soils as measured by MPN analysis (6.4 × 10⁶ cells g−1 in native wooded soil, 6.5 × 10⁶ cells g−1 in soil from a plot of corn, 1.8 × 10⁶ cells g−1 for soil from a soybean plot with a slurry added to the soil, 2.0 × 10⁵ cells g−1 for soil from a soybean plot with no slurry added, and 3.3 × 10⁴ cells g−1 for native grassland [bluegrass]). The degrees of nitrate reduction and nitrite production are also indicated for the 10−3 dilution of each MPN series.

