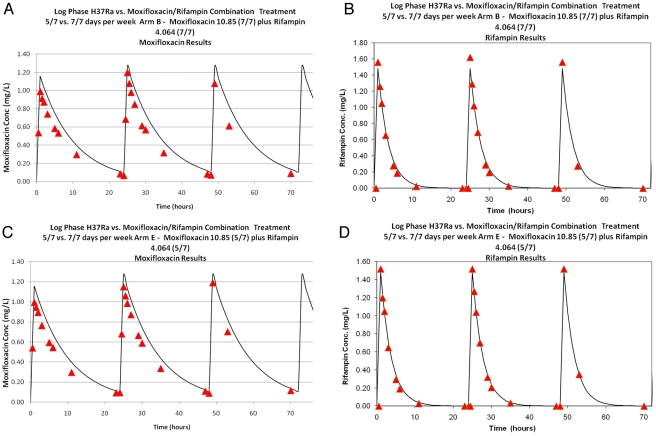
FIG 3 .
Moxifloxacin and rifampin concentrations (μg/ml) for the successful arm (A; arm B) versus failure arm (B; arm E). Solid curves are the targeted concentration-time profiles to be simulated in the hollow fiber systems. The red triangles are the measured concentrations of the respective drugs over the first 72 h of each experiment.

