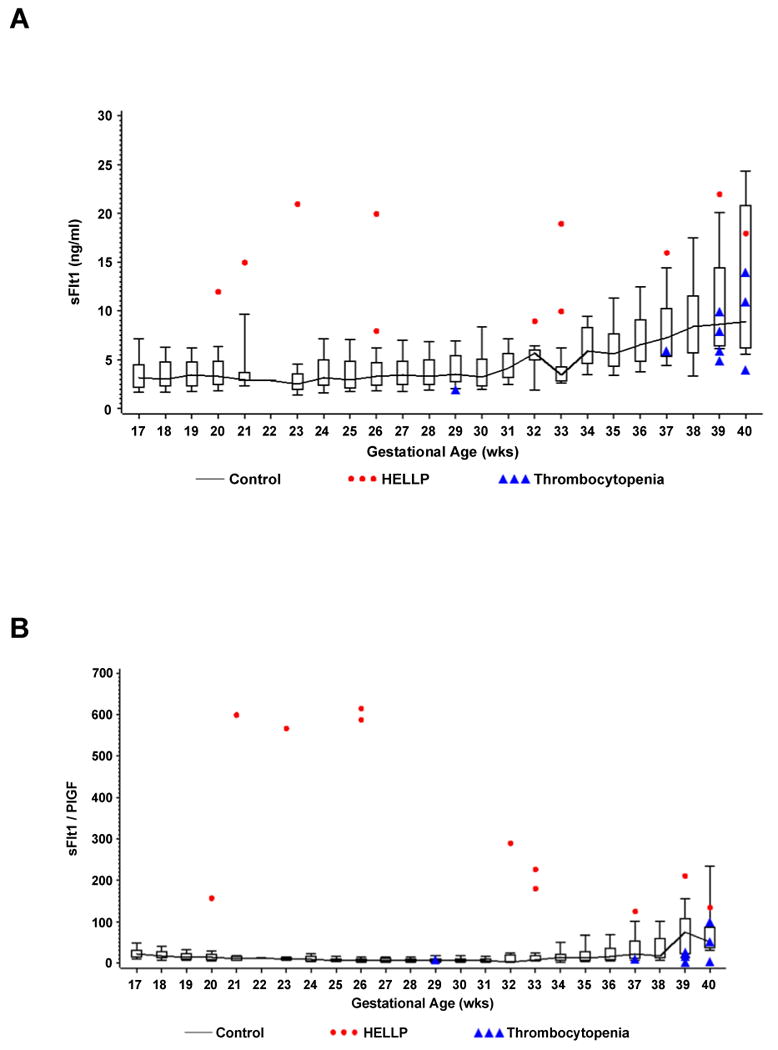
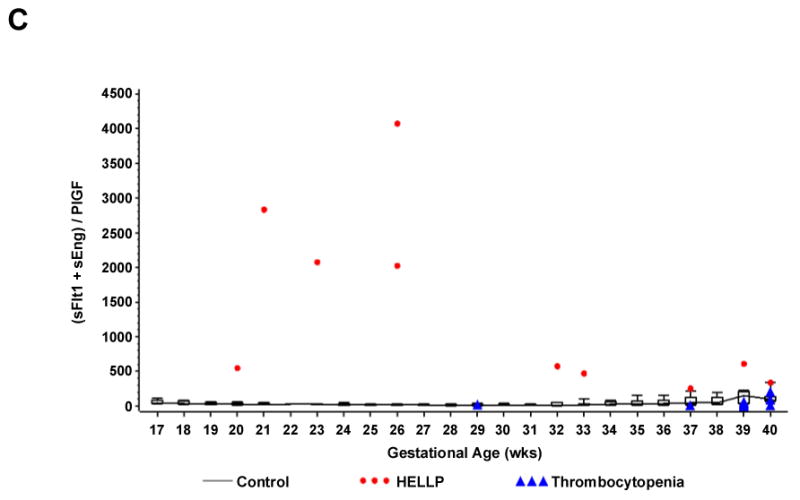
Figure 1.


Shows individual values of serum sFlt1 (Panel A), the sFlt1 / PlGF ratio (Panel B), and the composite ratio (sFlt1 +sEng) / PlGF (Panel C) in women with non- HELLP thrombocytopenia (gestational thrombocytopenia or immune thrombocytopenic purpura) or the HELLP syndrome by gestational age. Normal values for each week of gestation were derived from 3956 serum samples of 1564 randomly selected women from the CPEP trial who had remained normotensive throughout pregnancy and displayed as box and whisker plots. Each box represents the 25th through 75th percentiles; the whiskers extend to the 10th and 90th percentiles. The boxes are joined by a line connecting the median values.
