Figure 4.

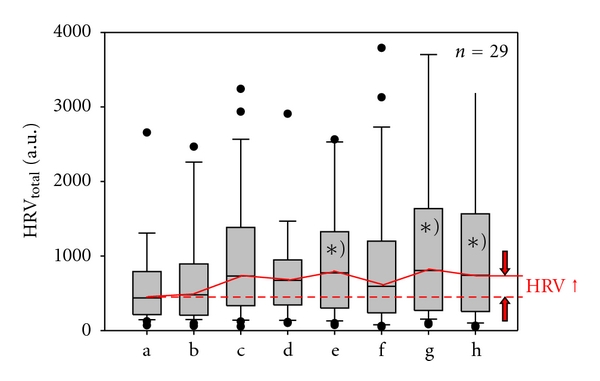
Total heart rate variability. Graphical box plot presentation of significant (∗) P < .05) changes during (e) and after (g, h) acupuncture. Note the significant increase in total HRV. For further explanations compare withFigure 3.

Total heart rate variability. Graphical box plot presentation of significant (∗) P < .05) changes during (e) and after (g, h) acupuncture. Note the significant increase in total HRV. For further explanations compare withFigure 3.