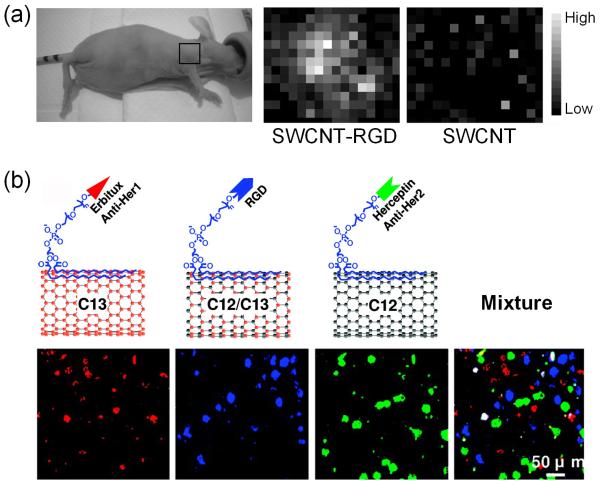
Fig. 2.
Raman imaging of SWCNTs. (a) Left: Photograph of an integrin αvβ3-positive tumor-bearing mouse depicting tumor area scanned with Raman spectroscopy (black box). Right: Raman tumor maps of mice receiving SWCNT-RGD conjugate or unconjugated SWCNT at 72 h post-injection. (b) Deconvoluted confocal Raman spectroscopy images of a mixture of three cell lines after incubation with a mixture of three different, molecularly targeted SWCNT conjugates. Each of the SWCNT conjugate has a different Raman signature (due to different carbon isotope composition) and was conjugated with a targeting moiety for a different molecular target. (Reprinted with permission from 64,70. © 2008 American Chemical Society.)

