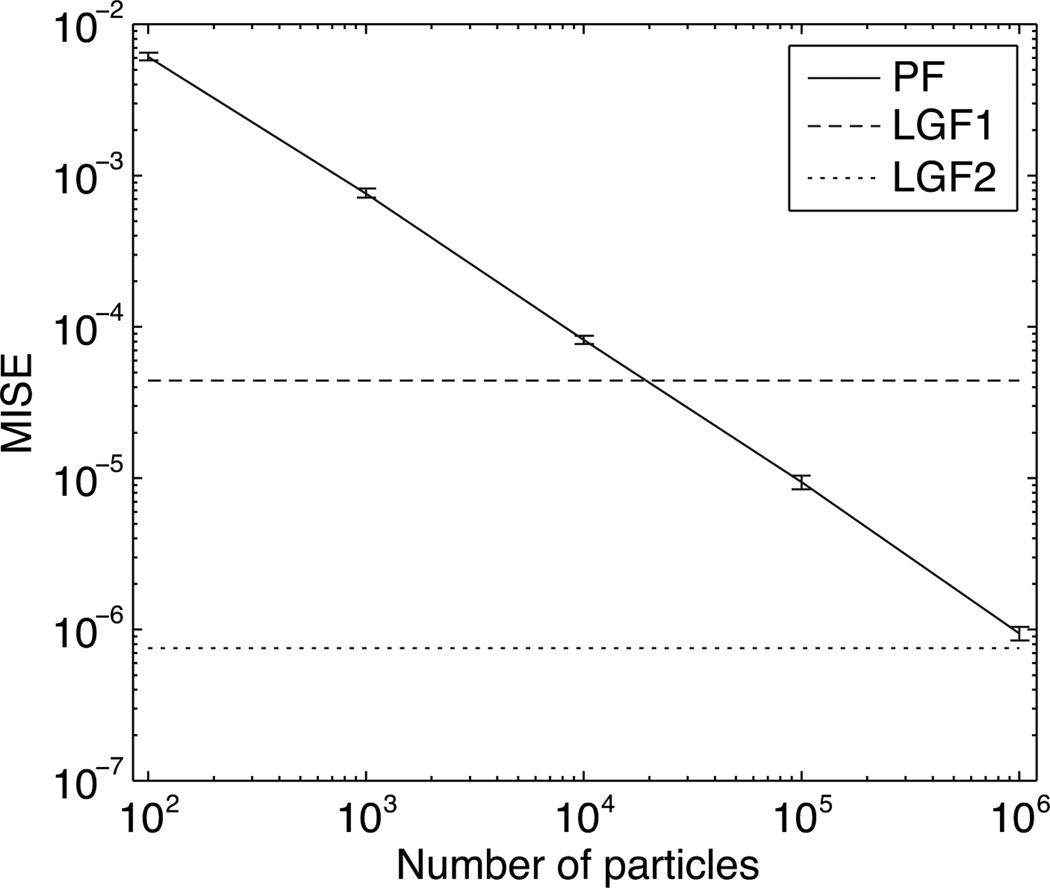
Figure 1.
Scaling of the MISE for particle filters. The solid line represents the MISE (vertical axis) of the particle filter as a function of the number of particles (horizontal axis). Error here is with respect to the actual posterior expectation (optimal filter). The dashed and dotted horizontal lines represent the MISEs for the first- and second-order LGF, respectively.

