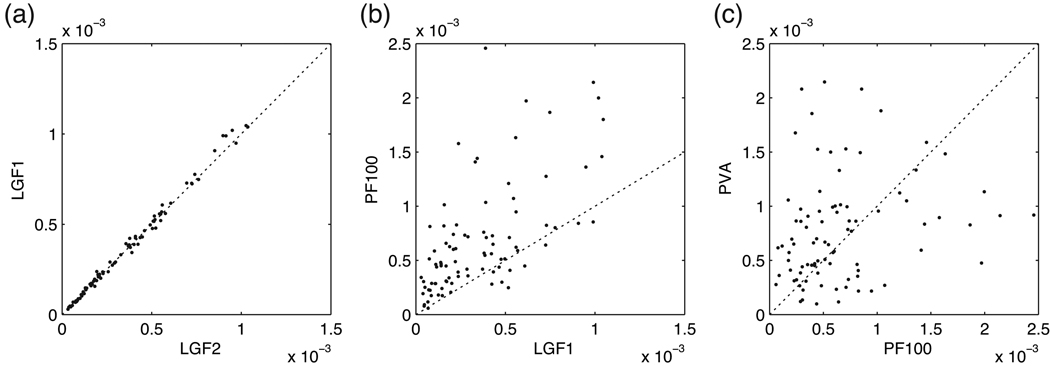
Figure 3.
Algorithm comparisons. The horizontal and vertical axes represent the MISE of different algorithms in estimating the true cursor position. Each point compares two different algorithms for a trial. Overall, 4 algorithms (LGF-1, LGF-2, PF-100 and PVA) were compared for 88 trials. (a) LGF-2 vs. LGF-1, (b) LGF-1 vs. PF-100, and (c) PF-100 vs. PVA.

