Figure 2.
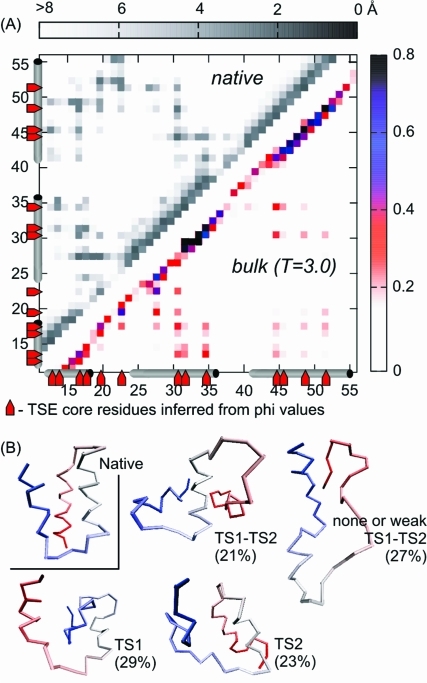
Structural characterization of BdpA transition state ensemble. (A) Averaged side-chain contact map (with 7 Å cutoff) of the BdpA nucleation core from bulk simulation at T = 3.0 (below the diagonal). The colors indicate the probability of contacts. Short-range contacts (up to i, i+3) are omitted for clarity. Native distance map (above the diagonal) is shown in gray scale, indicating pairwise distances. Native helices and extended hydrophobic core residues in the TSE, inferred from phi value analysis,(15) are marked at the borders of the map. (B) Examples of BdpA TSE structures (percentages are explained in Table 2) as compared to the native.

