Figure 3.
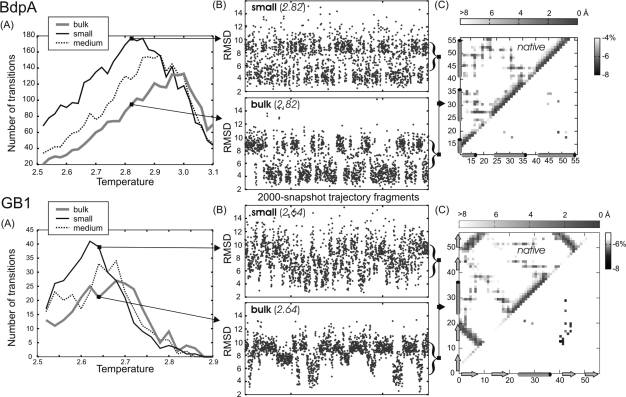
Summary of chaperonin and bulk simulations for BdpA and GB1. (A) Number of folding transitions between denatured and native-like ensembles, see also Materials and Methods, as a function of temperature. (B) The rmsd (from native) flowcharts at selected temperatures for small chaperonin and bulk systems. (C) Difference contact maps (below the diagonal) show the weakening of folding nuclei by the chaperonin (see the text). The maps were obtained by subtracting side-chain contact (7 Å cutoff) frequencies from chaperonin and corresponding (at the same temperature) bulk system simulations (preceded by the normalization over the number of TSE snapshots) and were shaded gray to show meaningful differences only. Native distance maps (above the diagonals) are given for reference.

