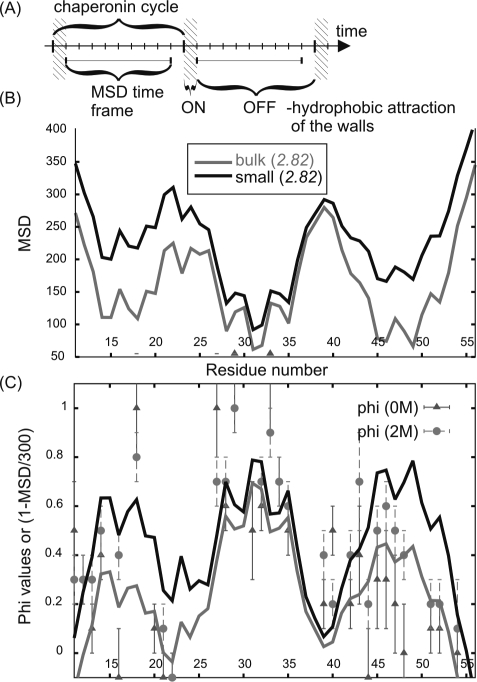
Figure 4.
Characterization of BdpA mobility and comparison with experimental Phi values. (A) Illustration of the chaperonin cycle and the time frame used for measuring chain mobility. (B) Profiles of the mean square displacement (MSD, measured in Å2) for BdpA bulk and small chaperonin simulations calculated for all of the simulation snapshots. (C) Comparison of residue mobility (plotted as: 1 – MSD/300) with phi values measured for 0 and 2 M GdmCl (denaturant) concentration (10).

