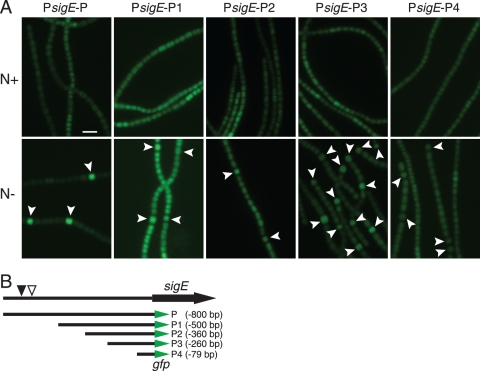
Fig. 3.
GFP reporter expression from different upstream regions of sigE. (A) GFP fluorescence micrographs of filaments for reporter strains grown with (N+, upper panels) and without (N−, lower panels) combined nitrogen for 24 h. (B) Map showing upstream regions of sigE driving the gfpmut2 reporter. Region P contains the entire 800-bp upstream intergenic region. The position of a conserved NtcA binding site is marked with a filled triangle, and a second potential binding site is marked with an open triangle. Heterocysts are indicated by arrowheads. Scale bar, 10 μm.

