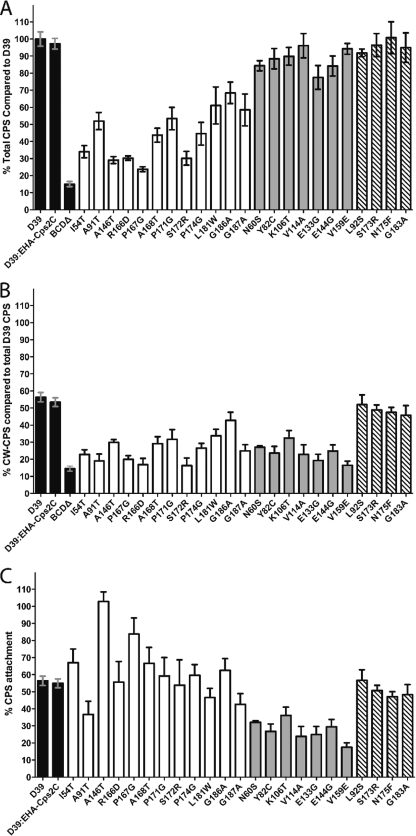
Fig. 4.
Quantitation of CPS by uronic acid assay. (A) T-CPS produced by various mutants as a percentage of D39. (B) CW-CPS produced by the various mutants as a percentage of T-CPS for D39. (C) CW-CPS as a percentage of the T-CPS produced by each mutant. Shading indicates the colony phenotype as follows: black, control strain; white, small; gray, mucoid; striped, WT.

