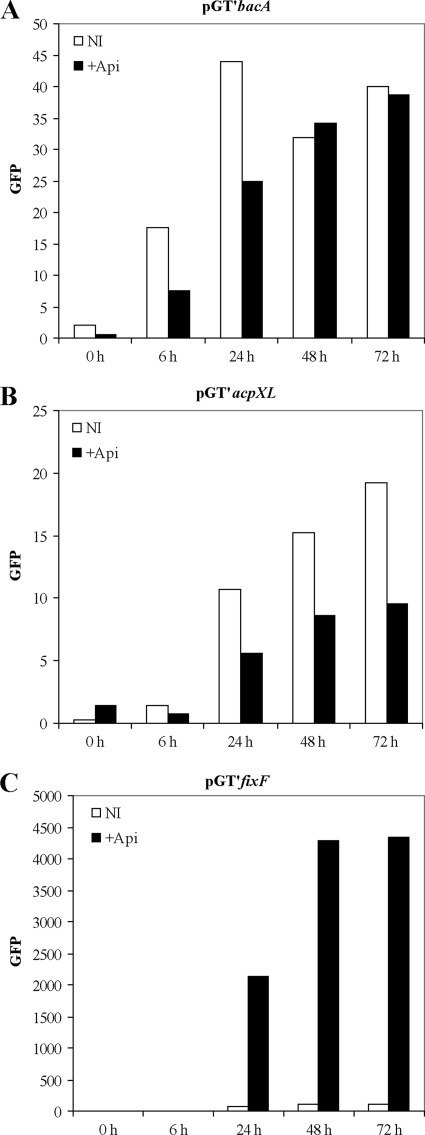
Fig. 2.
Measurement of bacA and acpXL expression. Expression analyses were performed with the bacA (A), acpXL (B), and fixF (C) promoter regions. The promoter regions were fused to a promoterless gfp gene and assayed at different time points in RMS and RMS supplemented with 10−6 M apigenin. The values for the empty vector control were subtracted from the actual readings, and data were normalized according to the OD600. Numbers shown are the averages for three replicate experiments.

